WiFi site survey: why measure before you install
An access point placed wherever there was an outlet is rarely where it is needed. This is how we measure, design and validate a WiFi network so it works with a full office, not just on test day.
Almost every troubled WiFi network has a similar origin: the access points were installed where it was easy to run a cable or where there was a power outlet, not where people needed them. The network is tested on a quiet day, it works, and the complaints come later: the meeting room where video calls drop, the storeroom with no signal, the afternoon when everyone connects at once.
A site survey is the study that prevents that scenario: the site is measured, the network is designed on data and the result is checked before handover. It is the difference between assuming the WiFi will work and knowing it.
Problems we see again and again
Access points where there was an outlet
They were placed for the installer's convenience: on top of a cabinet, above a metal ceiling or in a corner, far from the people using the network.
Dead zones behind walls and elevators
A concrete core or an elevator shaft blocks almost all the signal. On the other side, nobody gets a good connection.
Works empty, fails when full
The network was tested with no users. With a full office, each access point serves more devices than it can handle and everything slows down.
Access points on the same channel
Nearby devices on the same channel take turns to transmit. Adding badly configured access points can make the network worse instead of better.
Buying more equipment without fixing it
Complaints are answered with extenders or access points placed at random. More money is spent and the underlying problem stays.
Drops while moving
Calls drop when walking from one room to another because the coverage areas do not overlap enough to hand over from one access point to the next.
Coverage is not the same as capacity
A common mistake is designing only for the signal to reach. A modern access point can easily cover a large room, but a signal that reaches everyone does not mean there is enough capacity for everyone: the devices connected to the same radio share the channel and transmit in turns.
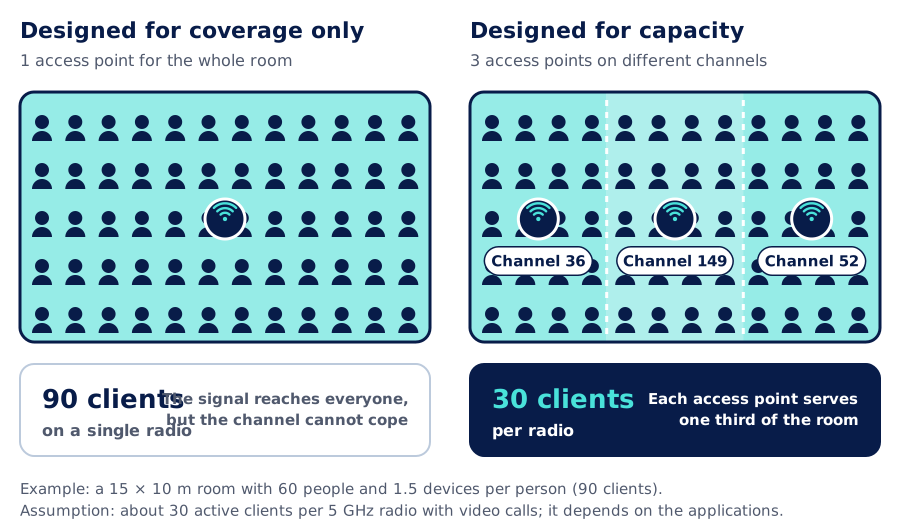
That is why a survey starts with questions that have nothing to do with signal: how many people will be in each space, how many devices each one uses, which applications (email, video calls, cloud systems) and when usage peaks. Those answers size the capacity; coverage is solved afterwards.
What a site survey measures
- Signal strength (RSSI). How much signal arrives from the access point, in dBm. Voice and video are usually designed for −67 dBm or better across the whole area; browsing needs less.
- Signal-to-noise ratio (SNR). Useful signal versus background noise. With about 25 dB or more, devices use high data rates; with a small margin, they slow down and retransmit.
- Channel interference. How many access points, yours and your neighbors', are heard on the same channel. 2.4 GHz has only three non-overlapping channels (1, 6 and 11), so space runs out fast.
- Overlap for roaming. How much coverage areas overlap, so a phone can move from one access point to another without dropping the call.
- Real performance. Throughput, latency and packet loss measured while connected to the network, just as users experience it.
Before and after: the same floor, a different design
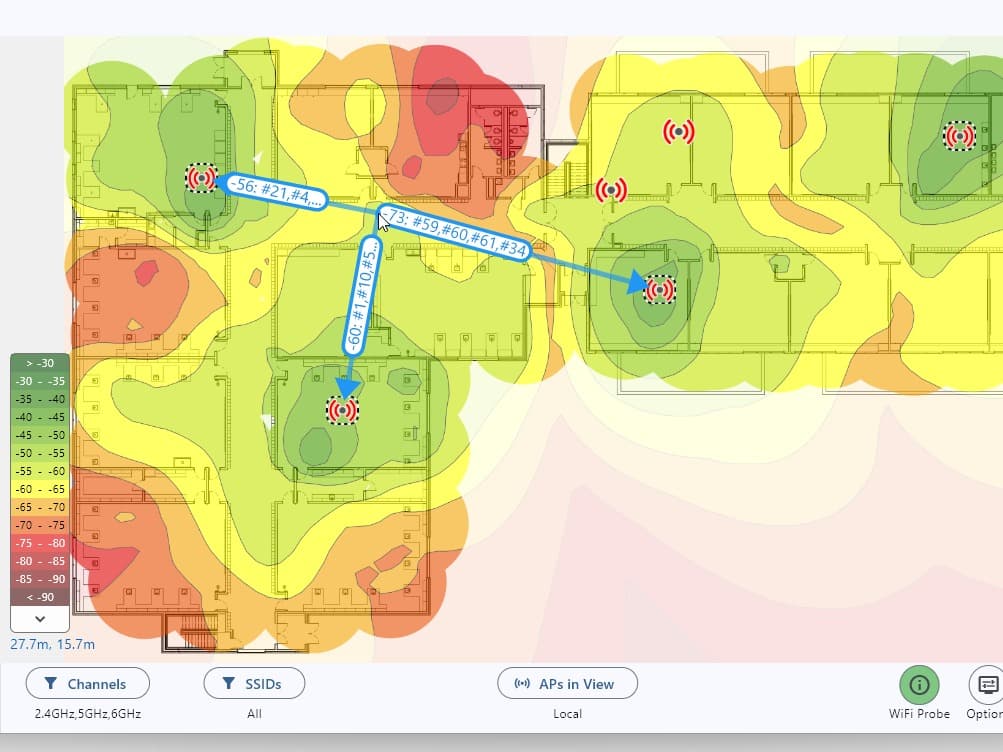
The heat map is the core tool of a survey: it paints on the floor plan the signal a device receives at every spot. This example shows an office of about 700 m² with an elevator core in the middle and a training room behind a concrete wall.
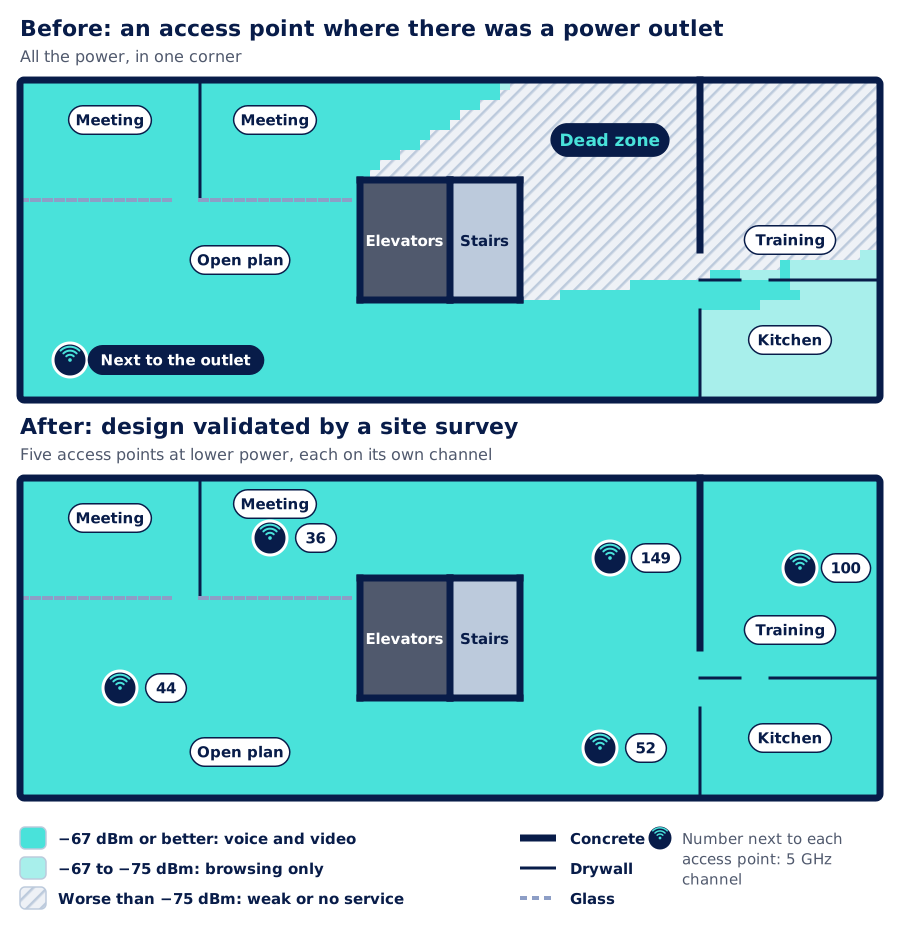
Before, a single access point at full power covers half the floor well and leaves everything behind the core without service. After, five access points at lower power, each on its own channel, cover the entire floor.
Lowering the power is not a mistake. Smaller cells mean fewer users per access point and less interference between them. Besides, an access point at full power "shouts" louder than a phone can answer: the phone sees a good signal, but the access point cannot hear it well.
Materials matter
Every wall takes something away from the signal, and not all of them equally. That is why a serious design is not done on a blank floor plan: you need to know what the building is made of and, when in doubt, measure it on site with a test access point.
| Material | 2.4 GHz | 5 GHz | In practice |
|---|---|---|---|
| Standard glass | 2 to 3 dB | 3 to 4 dB | Almost transparent |
| Drywall partition | 3 dB | 4 to 5 dB | Light attenuation |
| Brick wall | 6 to 8 dB | 10 to 12 dB | Medium attenuation |
| Concrete wall | 10 to 15 dB | 15 to 25 dB | High attenuation |
| Metal-coated (low-e) glass | 10 to 25 dB | 15 to 30 dB | Can block like a wall |
| Elevator or metal structure | 25 dB or more | 30 dB or more | Practically blocks the signal |
Approximate example values for a single pass of the signal; they vary with thickness, rebar, moisture and manufacturer, which is why they are verified on site. Every 3 dB less is half the power; every 10 dB, one tenth.
Three types of survey, three moments
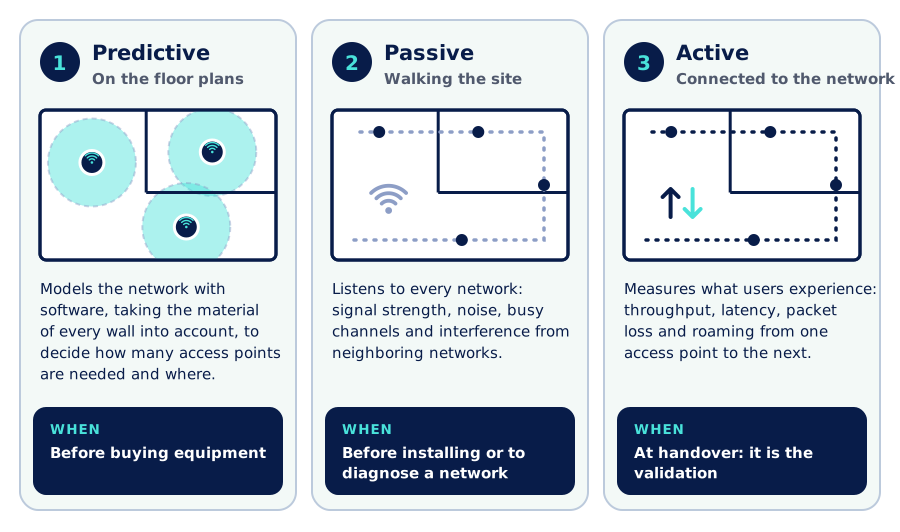
The predictive survey estimates quantities and budget before buying. The passive survey confirms on site what the model assumed and uncovers what the floor plan does not show: neighboring networks, a metal ceiling, a storeroom with full shelves. The active survey is the final test, the one that proves the installed network meets the design. When there is non-WiFi interference, such as microwave ovens or industrial equipment, we add a spectrum analysis.
Our process
- 1
Assessment and survey
We talk with the people who use the network: how many people, which devices, which applications and which spaces are critical. We gather floor plans and construction details.
- 2
Predictive design
We model the network with the building materials and define the number, location, channels and power of the access points, along with the cabling and switches they need.
- 3
Walking the site
We run the passive survey and measure the real attenuation of walls we are unsure about with a test access point. We adjust the design with what we find.
- 4
Phased implementation
Each access point goes where the design says, with its certified network outlet, configured with the channel and power plan, coordinating the work with your operations.
- 5
Validation survey
With the network running, we measure signal, interference and performance across the site, and fix whatever falls short.
- 6
Support
We hand over the heat maps, the location and configuration of every device and the record of what was measured: the baseline for any future adjustment or expansion.
On site

A survey is done on foot
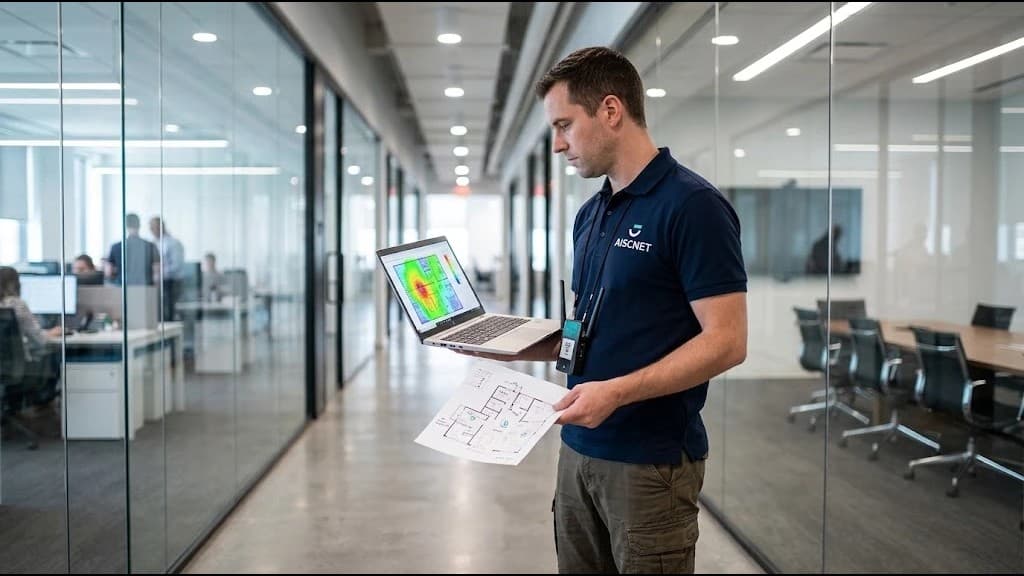
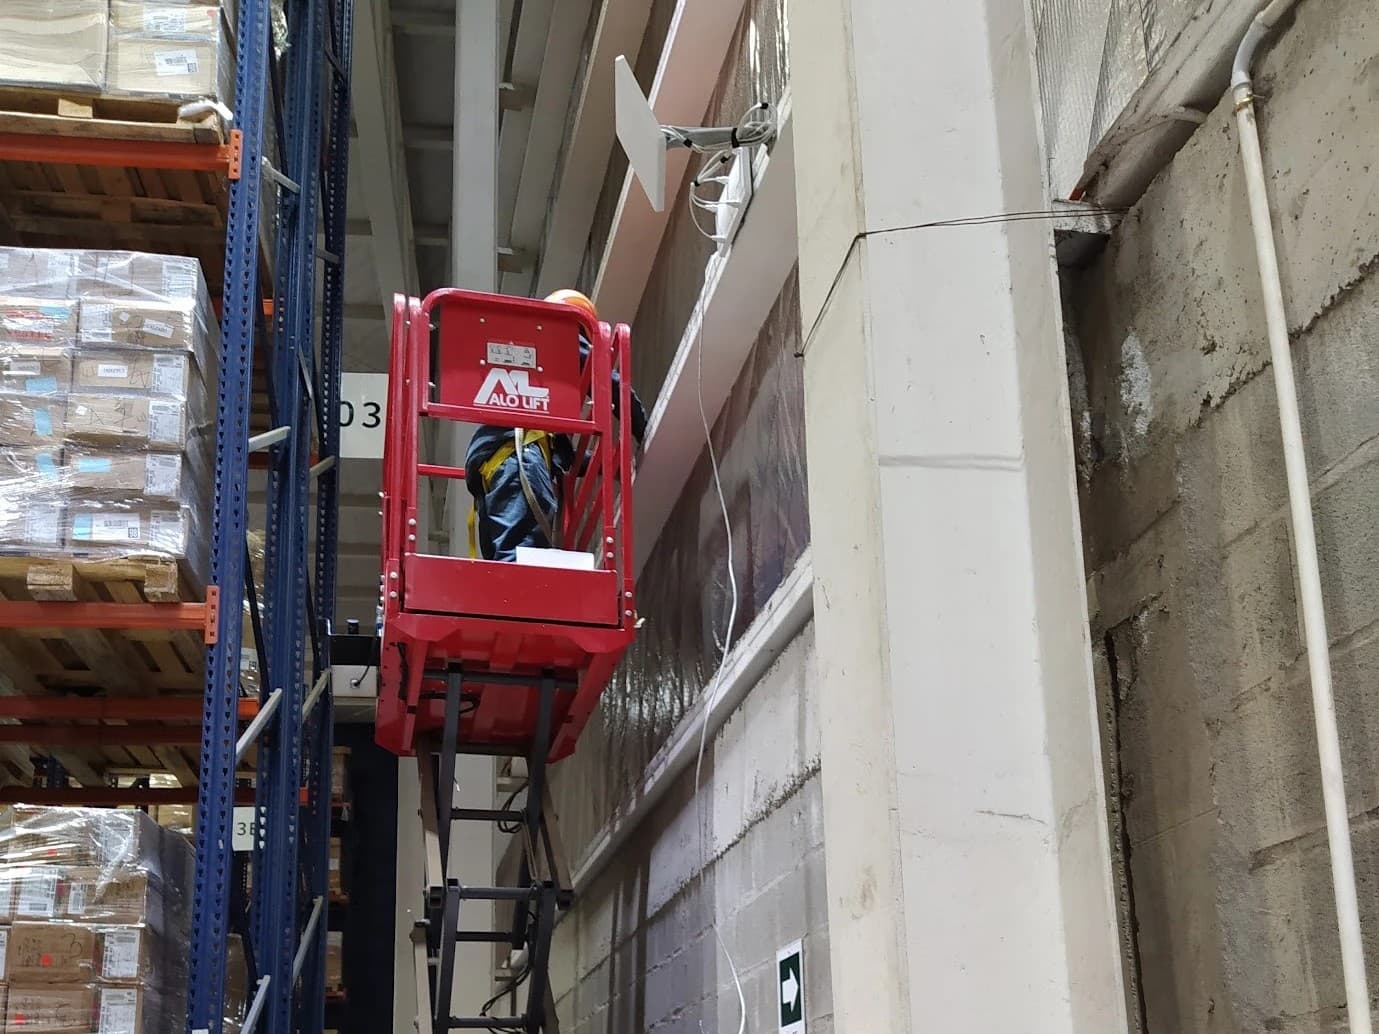
The technician walks every hallway, room and storeroom with a laptop or a dedicated meter, marking their position on the floor plan while the equipment records everything it hears. That is how the things no floor plan shows come up: the metal ceiling of a room, the neighbor's network on the same channel or the shelving that blocks the signal at the back of the storeroom.
What a survey changes
| Installing without measuring | Measuring before installing | |
|---|---|---|
| Equipment location | Wherever there was an outlet or cable | Where the people and devices are |
| Number of devices | Guessed | Calculated for coverage and capacity |
| Channels and power | Factory or automatic settings | Planned and verified |
| Dead zones | Found through complaints | Detected at design |
| At handover | "It works" | Heat maps that prove it |
| Future changes | No reference | A measured baseline |
General comparison; it does not refer to any specific installation.
Further reading
AISCNET Learning, our technical training platform, has free material on these topics:
- WiFi That Performs: Channels, Rates & Airtime: why WiFi is slow even when it shows a good signal.
- WiFi Channel Planner: detects overlapping channels and co-channel interference.
- WiFi Airtime & Capacity: how much airtime each client uses and when a cell saturates.
- WiFi PHY Rates (MCS): which data rate you get depending on modulation, channel width and spatial streams.
And on this blog:
- High-density WiFi for events, auditoriums and halls: when the challenge is capacity.
- WiFi for large hotels: how we design coverage room by room.
- A well-segmented network: what happens behind the access point.
Tell us what you need through our contact form or learn more about our connectivity and networks service.
- WiFi
- Site survey
- Mapa de calor
- Cobertura WiFi
- Capacidad WiFi
- Interferencia
- Puntos de acceso